Albany, NY, inventory deficit reached an all-time low of -40.4%, with only 1,306 homes on the market in late 2024. This steady decline in inventory suggests increased buyer activity and heightened demand, resulting in tighter market conditions. Such dynamics often contribute to rising home prices and predict upward pricing pressure. In the Reventure App graph below, you can see the Albany metro’s inventory decline over the years:
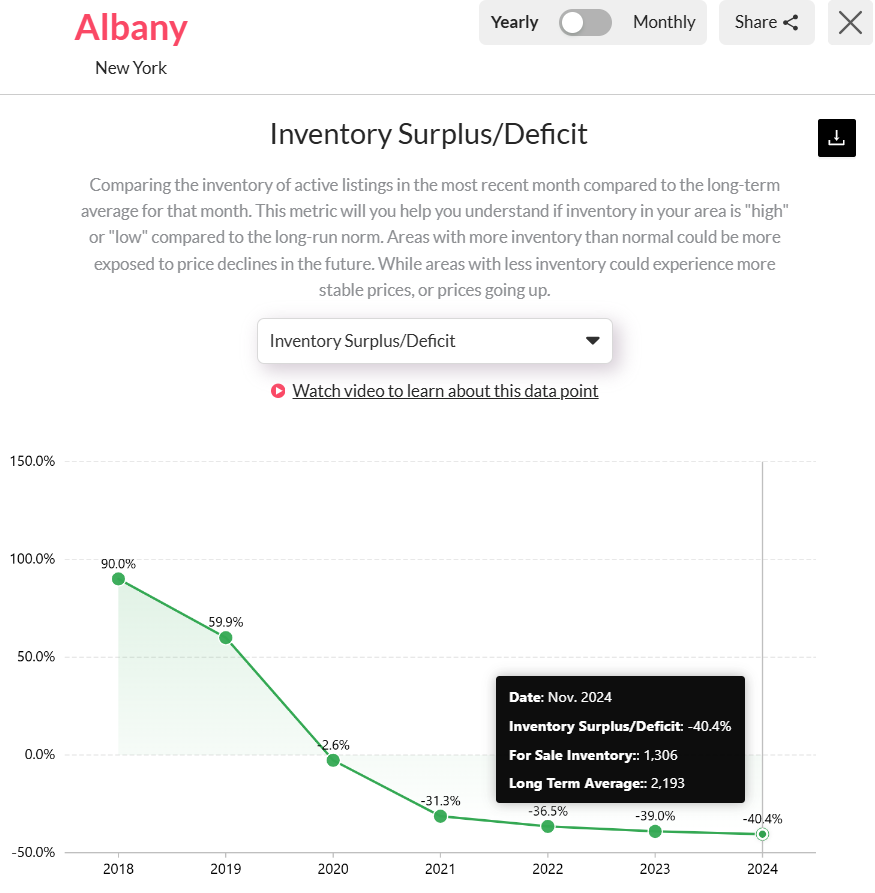
Albany, NY’s inventory deficit reached -40.4%, the lowest in the past 6 years. Access the above graph here. [Link]
To fully understand Albany’s inventory challenges, it’s important to look back at the broader trends over the last several years. The Albany, NY metro area experienced its most significant inventory surplus (+90%) in 2018, offering buyers many options. However, this trend started to change in 2019, when the surplus reduced to +59.9%, reflecting a gradual decrease in buyer activity.
By 2020, Albany had nearly reached parity with a slight deficit of -2.6%, as buyer demand began outpacing available listings. An intensifying trend gained momentum from there, plunging the market deeper into deficit. By 2022, the inventory deficit stood at -36.5% and has only intensified since, reaching the current low of -40.4% in late 2024. This contraction in inventory aligns with increased buyer competition and the likelihood of reduced days on the market, as reflected in Albany’s market metrics.
Inventory Surplus/Deficit Across Counties in the Albany Metro Area
While inventory challenges persist across Albany’s metro area, individual counties have experienced varying inventory deficits. According to Reventure App data, Schoharie County showed the highest inventory balance with a surplus of -35.5%. At the same time, Albany County exhibited the largest inventory deficit at -43.0%, reflecting contrasting market dynamics within the region as well as Schenectady County showed a notable shortage at -42.6%.
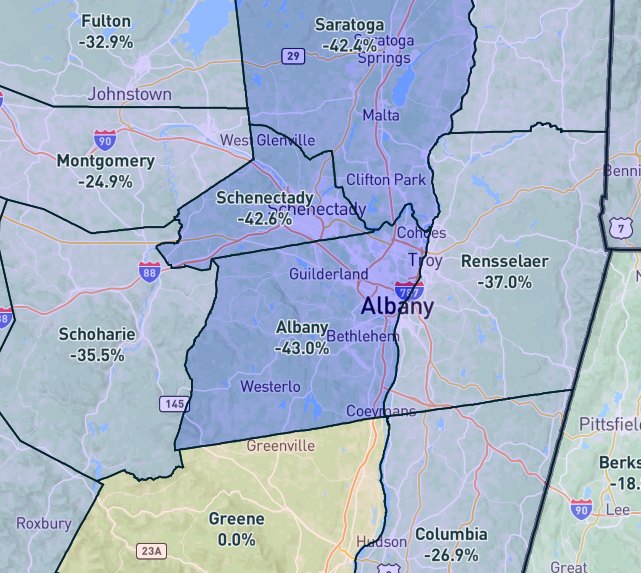
The counties in Albany, NY reveal a trend of housing inventory scarcity. Access the data here. [Link]
Saratoga County recorded a deficit of -22.4%, Columbia County had -26.9%, Rensselaer County faced a deficit of -37.0%, Warren County had -30.2%, and Washington County experienced -33.5%. These trends reveal a general scarcity of housing inventory across the region, with some counties being more impacted than others. You can also see a Long Term Growth for specific counties on the Reventure app.
Albany, NY Market Predictions for 2025
Due to the sharp inventory deficit, the Home Price Forecast for Albany, NY, stands at 62/100 in late 2024, signaling strong buyer demand and a competitive housing environment. It’s important to note that a score below 45 denotes a declining market, a score between 45 and 55 represents stability, and above 55 indicates an appreciating market on Revanture App. With a score of 62, Albany’s market stands as an appreciating market with steady year-over-year growth in home prices.
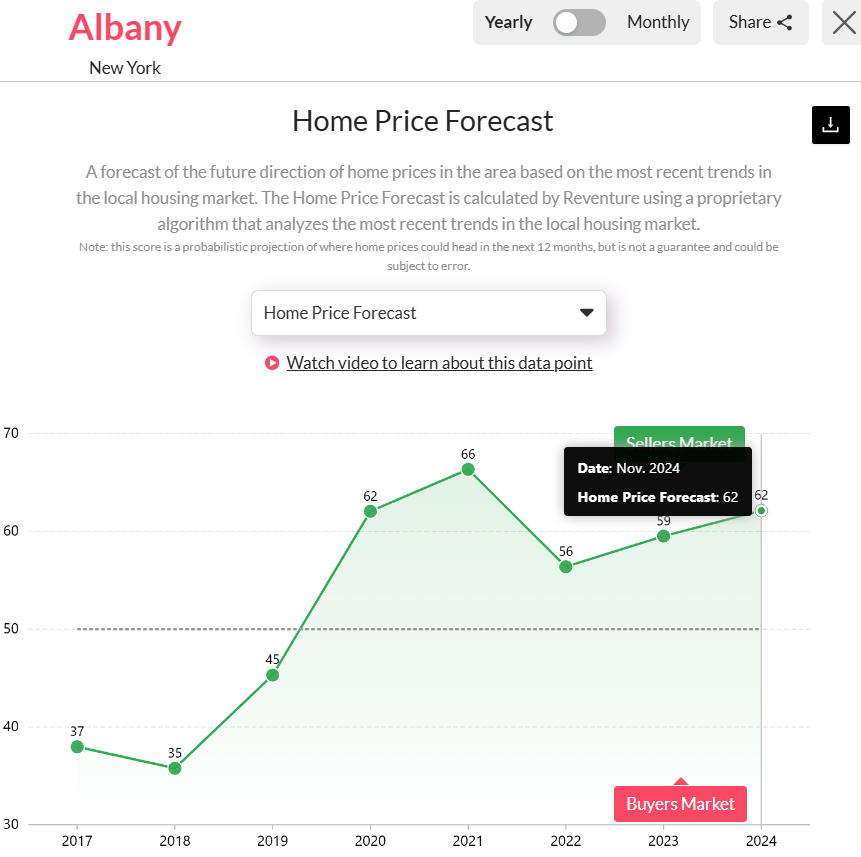
Home Price Forecast score for Albany, NY reached 62 in late 2024. Access the above graph here. [Link]
In 2025, Albany’s housing market is projected to maintain its upward momentum due to several key factors. The inventory deficit of -43.0% and low available homes relative to demand support continued price appreciation. Moreover, high buyer demand and competitive pressures will result in shorter days on the market and reduced price cuts.
Therefore, until the inventory balance improves, Albany’s housing market will remain highly competitive, favoring sellers over buyers. For more detailed market data and analysis, access the housing market data at a ZIP-code level in Albany, NY, on the Reventure App.
Click to Access Inventory Data for New York and other States on Reventure App.