Boise City, ID’s housing market is seeing an increase in inventory entering 2025, reflecting a stable market with subtle indications of potential future price declines. The metro’s homes for sale reached 2,083 with a 10.3% year-over-year inventory growth, according to data available on Reventure app. This increase in homes for sale marks a rebound from previous years, offering buyers more opportunities in the market.
Boise City, ID Sales Inventory Growth YoY Analysis
The homes for sale trend in the Boise, ID metro area reflects fluctuating inventory dynamics over the years. Between 2017 and 2020, inventory gradually decreased, bottoming out in 2020 with 670 active listings due to high buyer demand and limited supply. However, inventory spiked to 3,103 in 2022, coinciding with reduced buyer demand and increased sellers. It resulted in longer days on the market and more frequent price cuts.

The year-over-year inventory growth rate for Boise, ID, reveals a 10.3% increase in late 2024. Access the Sales Inventory Growth YoY graph of Boise City, ID here. [Link]
In late 2024, the number of homes for sale reached 2,083, a 10.3% year-over-year growth compared to 1,888 in December 2023. This upward trend in inventory suggests a softening market with reduced buyer competition, leading to longer days on the market and increased price cuts. Such conditions often signal a risk of future home price declines.
Homes for Sale Trend in Different Counties of Boise City, ID
The Boise metro housing market shows varying inventory levels across its counties entering 2025. Ada County leads with 1,204 homes for sale, reflecting increased seller activity, longer days on the market, and more price cuts due to reduced buyer demand. Canyon County follows with 674 listings, facing similar trends of rising inventory and pricing pressures. Smaller markets like Boise County (95 listings), Gem County (83 listings), and Owyhee County (29 listings) have significantly fewer homes for sale.
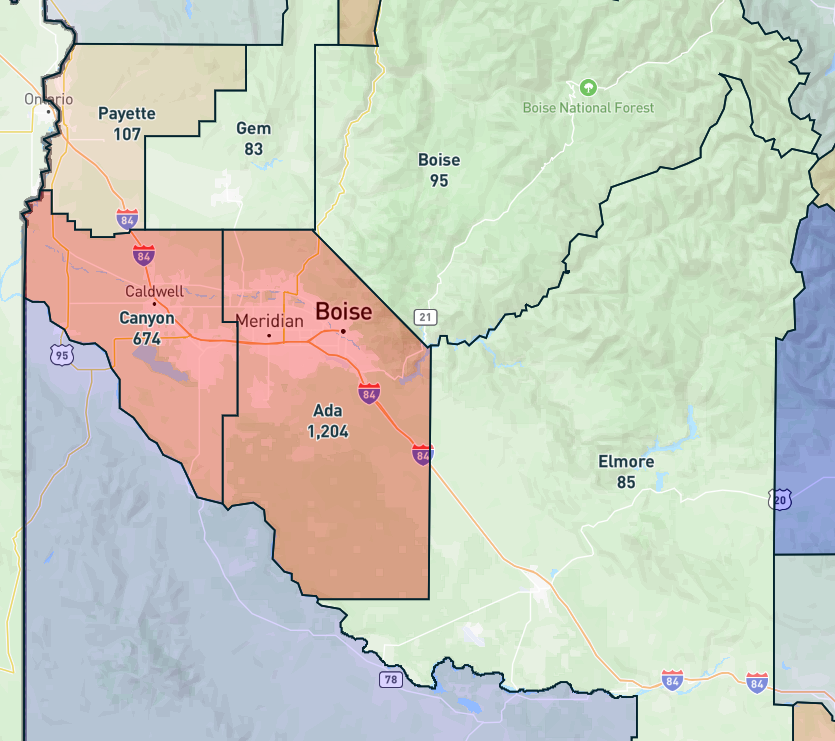
Inventory levels in the Boise metro housing market differ across the counties. Access the DOM map of Boise City’s Counties here. [Link]
The disparity highlights Ada and Canyon counties as the most dynamic, adjusting to changing market conditions. Ada County saw steady declines from 2017-2020, followed by a sharp 125.7% spike in 2021. However, it stabilized at 1.6% growth in 2024 with 1,204 homes for sale according to the data available on Reventure App. Canyon County experienced more volatility, including a big 210.5% surge in 2021 and a rebound to 19.8% growth in 2024. Both counties reflect market shifts with increased inventory signaling reduced buyer demand, longer days on the market, and potential price declines.
Boise City, ID Housing Market Predictions for 2025
The Boise City, ID housing market is projected to remain stable with a slight downward tilt in 2025, as reflected by a home price forecast score of 48 out of 100 on the Reventure App. This score suggests that while the market is stable, it is showing signs of cooling but has not yet transitioned into a declining phase. It’s important to note here that a score below 45 indicates a declining market, 45-55 signals stability, and above 55 suggests an appreciating market on Reventure App. Boise’s current score places it within a balanced range, though market dynamics are shifting.
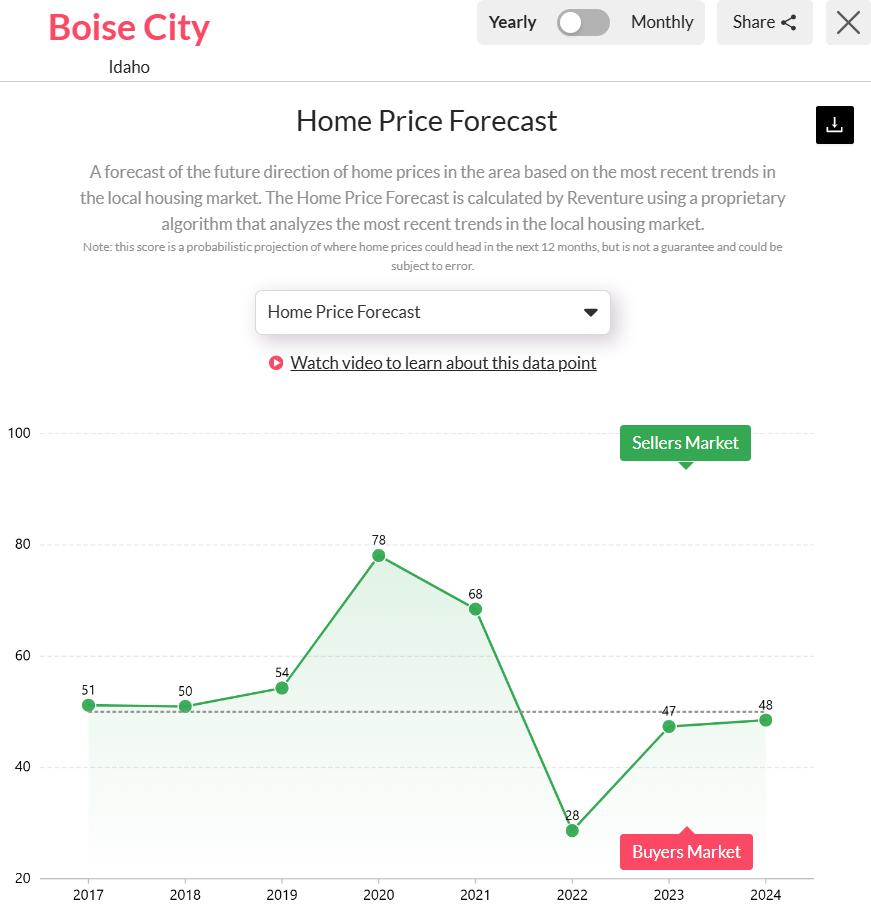
Boise, ID Home price forecast score reached 48 in late 2024. Access the home price forecast score chart here. [Link]
However, with a score of 48, Boise’s housing market is seeing reduced buyer demand, increased seller activity, and longer days on the market. These conditions have led to more price cuts, signaling reduced competition and the potential for future home price declines. Overall, while the market remains in the stability range, the downward tilt suggests a gradual softening in demand and pricing pressure. If you want a detailed analysis of the Boise, ID metro area, explore the housing market data at the ZIP-code level on Reventure App.