Existing home sales fell to just 4.02 million in March 2025, marking the lowest level for any March since 2009. This steep drop is a clear sign that homebuyers are still stepping back from the housing market. Despite falling mortgage rates earlier this year, many buyers remain hesitant due to high home prices and economic uncertainty. The slowdown is affecting nearly every corner of the market. U.S. sales are down 14.9% year-over-year in the most affordable price tier ($0–$ 100,000), and even pricier homes above $1 million are seeing a sharp 13.8% annual increase, indicating a shift in buyer demand.
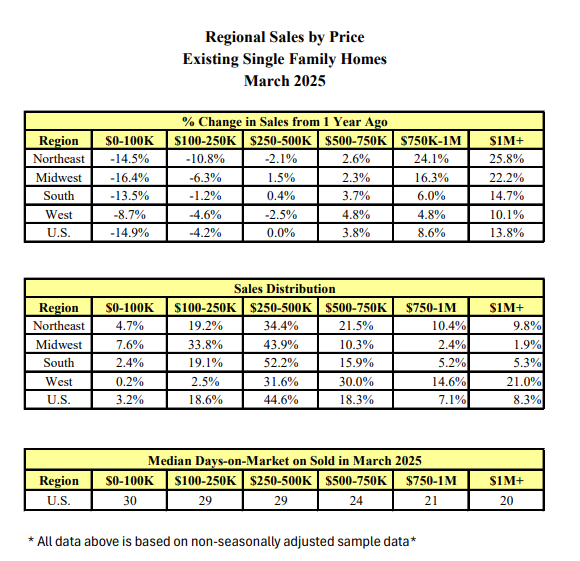
Luxury home sales rise as lower-priced segments lag in March 2025. Access the above table here. [Link]
Moreover, the data show that while luxury segments saw more activity, affordable homes are sitting on the market longer and selling less. For example, sales of homes priced $100,000–$250,000 dropped 4.2% nationally, and homes in this tier had a median time on the market of 29 days. These numbers highlight how buyers, especially in lower price ranges, are still on strike, waiting for better deals or greater stability.
Home Sales Drop in the U.S. Further, While Price Growth Slows in 2025
In March 2025, existing-home sales dropped 5.9% from the previous month and were down 2.4% compared to the same month a year earlier. This steady decline shows how buyer activity is still well below normal. In fact, sales are now nearly 37% lower than their peak during the pandemic in late 2021, when demand was fueled by low mortgage rates and remote work trends.
Moreover, while sales fell, prices continued to rise, just not as quickly. The median sale price in March was $403,700, a 2.7% increase from the previous year. This was the slowest pace of price growth in over a year, suggesting that while sellers are holding prices high, buyer resistance is starting to affect the market.
Affordability Worsens as Sales Hit Historic Low, But Wealthy Buyers Keep Spending in 2025
Home sales have fallen to their lowest level for any March since 2009, with just 4.02 million existing homes sold nationwide. This marks a dramatic 37% drop from the market’s peak in late 2021, when sales had soared above 6.7 million. Despite a slight bounce in some months, the overall trend remains downward as shown in the long-term sales chart, with no meaningful recovery in sight.
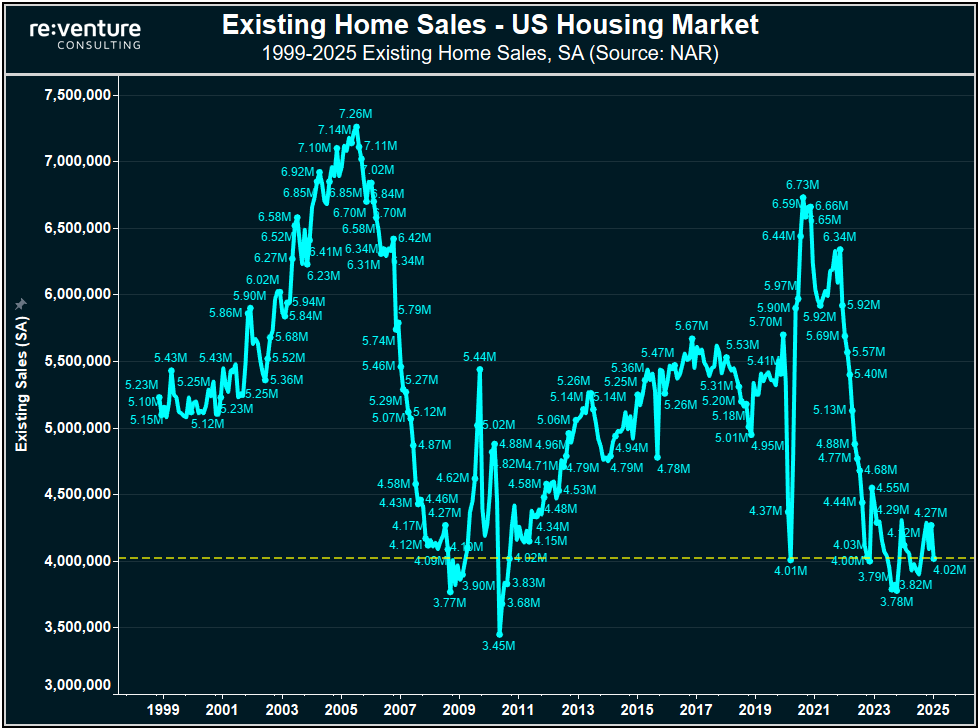
Existing home sales fell to 4.02M in March 2025, the lowest March reading since 2009. Access the above graph’s data here. [Link]
The main reason is a severe lack of affordability. Mortgage rates are currently at 6.6%, making monthly payments harder to manage. At the same time, home values remain near record highs, still over 40% higher than they were before the pandemic boom. For many average buyers, that means even if they want to buy, they simply can’t afford to or fail to qualify for a loan. High interest rates, paired with steep prices, have priced many middle-class individuals out of the market. However, not all segments are suffering. The luxury end of the market is holding up better.
Sales of homes priced above $1 million are up 13.8% year-over-year, with notable strength in the Northeast and Midwest. This suggests that wealthier buyers remain active and are less affected by borrowing costs. If you need ZIP code-level information on the current housing situation, sign up for Reventure Apps’ premium plan for just $39/ month. Get exclusive access to various market metrics across any state, metro, county, or ZIP code in the U.S.
FAQs about The Housing Market Slowing in 2025
1. Why Are Existing Home Sales So Low in 2025?
Existing home sales have dropped due to a combination of high mortgage rates (currently 6.6%) and home prices that remain over 40% above pre-pandemic levels. This has made affordability a significant challenge for average buyers.
2. Are Home Prices Falling Along with Sales?
Not exactly. While sales have declined, home prices are still rising, though at a slower pace. In March 2025, the median price rose 2.7% year-over-year, the slowest growth in over a year. This shows that sellers are holding firm even as demand weakens.
3. Which Price Segments Are Performing Best?
Luxury homes are seeing the most strength. Sales of $1 million+ homes rose 13.8% year-over-year, especially in the Northeast and Midwest, as wealthier buyers remain less affected by interest rates and inflation.