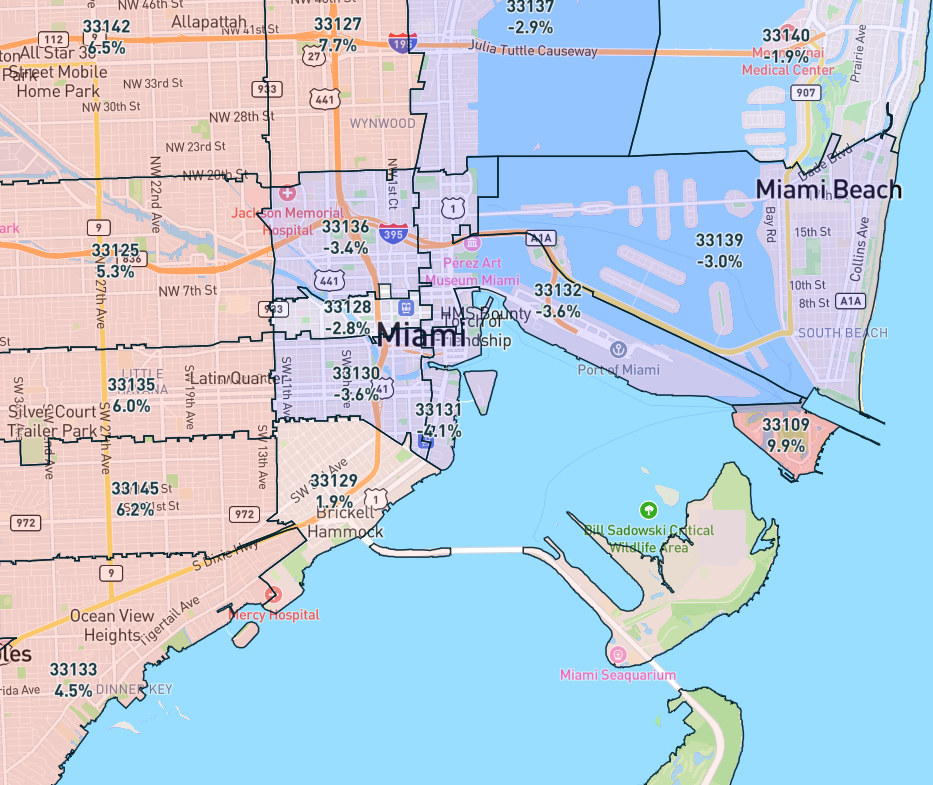
Miami’s real estate market entered 2025 with a modest 1.8% year-over-year growth in home values, reaching an average of $486,757. After hitting peaks earlier in the period, the year-over-year (YoY) growth rate has slowed recently. This deceleration reflects shifting market conditions, including increased inventory levels (44,833 homes for sale) and rising mortgage rates. This slowdown will offer potential opportunities for buyers as price growth becomes more manageable.
Miami, FL’s Home Value Growth YoY Analysis
Before the pandemic, Miami’s home value growth YoY was relatively stable, with moderate increases reflecting consistent demand and market balance. In 2019, the growth rate was 3.3%, demonstrating steady appreciation without drastic changes. However, as the pandemic emerged in early 2020, housing market dynamics shifted significantly due to low mortgage rates and increased demand for residential properties. By the end of 2021, Miami’s YoY growth surged to 16.3%, marking a peak as buyers competed for limited inventory.
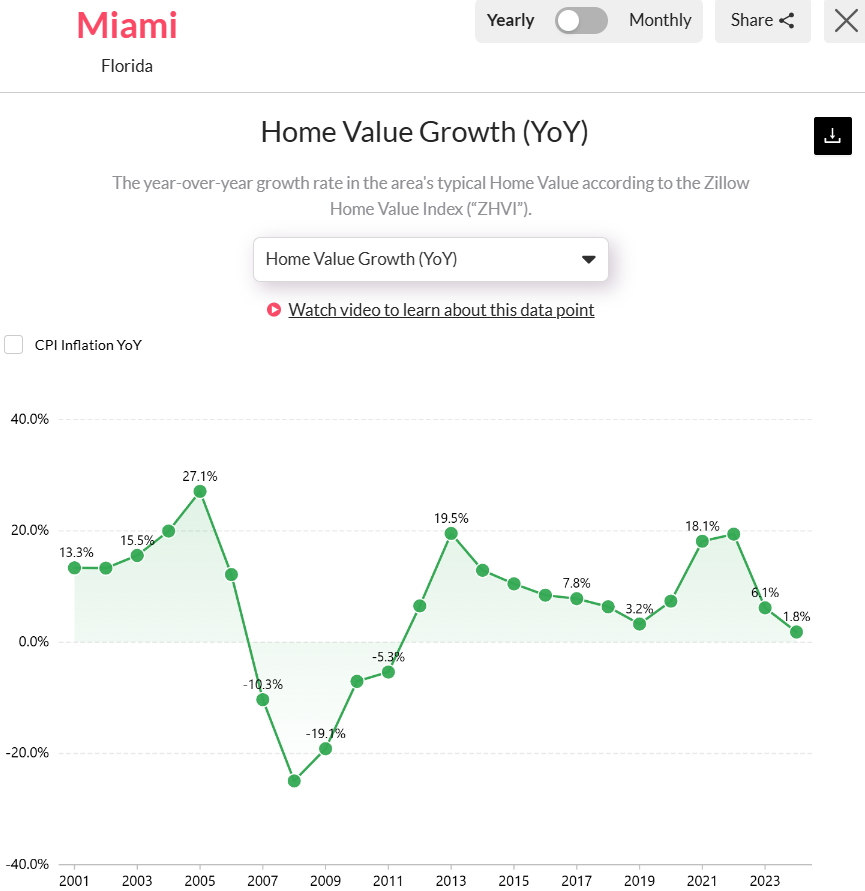
Miami Home Value Growth slows to 1.8% in late 2024 indicating market cooling. Access the Home Value Growth YoY chart of Miami, FL here. [Link]
Post-pandemic, the market began stabilizing as supply caught up with demand and interest rates increased. In 2022, YoY growth slowed to 7.6%. And by late 2024, it further declined to 1.8% reflecting cooling demand and growing inventory levels. The average home value entering 2025 reached $486,700. This shift from rapid appreciation to stabilization indicates a rebalancing market, offering more opportunities for buyers while moderating price growth.
Home Price Trend in Counties of Miami, FL
Miami’s housing market in 2025 reveals varying trends across its three counties Miami-Dade, Palm Beach, and Broward. Miami-Dade County recorded a 4.1% year-over-year home value growth with home prices reaching $531,998, the highest compared to other counties of the Miami Metro. Moreover, Palm Beach County experienced a 0.5% YoY growth with home prices reaching $480,603. Broward County also showed a modest 0.7% YoY growth with prices reaching $435,159.

Broward and Palm Beach experienced moderate home value growth YoY compared to Miami-Dade. Access the Home Value growth map of Miami’s counties here. [Link]
Miami-Dade’s home value growth has fluctuated significantly over the years. It peaked at 16.3% in 2021, driven by post-pandemic demand, before cooling to 7.6% in 2022 and further moderating to 4.1% in 2023. These trends reflect a shift from rapid price hikes to a more stable market, with factors like increased inventory and balanced demand influencing growth. This stabilization positions Miami-Dade as a leading yet more tempered housing market in the region.
Miami, FL’s Housing Market Predictions in 2025
Miami’s housing market in 2025 is projected to remain in a slightly declining phase, with the Reventure App’s forecast score of 44 out of 100 in late 2024. It’s important to note that on Reventure App, a score of 45-55 indicates a stable market, with 45-49 showing stability with a downward tilt and 51-55 indicating stability with an upward tilt. Scores below 45 suggest a declining market, while those above 55 signal an appreciating market.
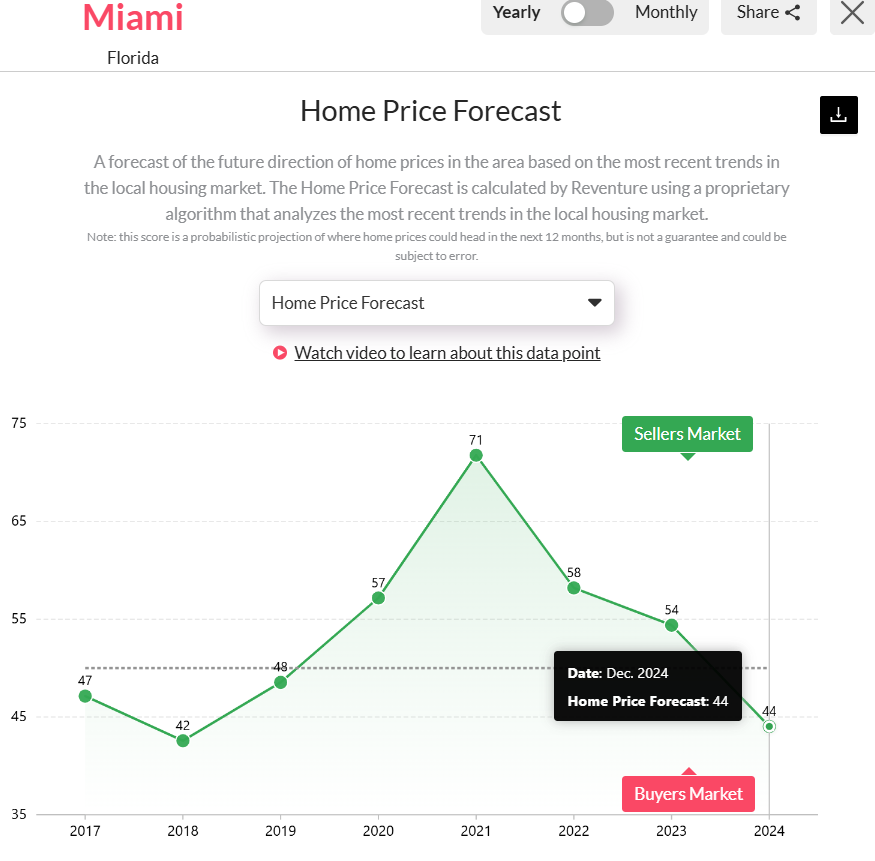
Miami, FL Home price forecast score reached 44 in late 2024. Access the home price forecast score chart here. [Link]
The current Miami score indicates reduced buyer demand and a likely continuation of current trends, such as rising inventory, longer days on the market, and increasing price cuts. With more homes available and reduced buyer competition, future home price declines are anticipated. These conditions suggest a favorable environment for buyers looking for better deals. If you want a detailed analysis of the Miami, FL metro area, explore the housing market data at the ZIP-code level on Reventure App.