Top 10 Cities where Sellers are Cutting the Price
By Nick Gerli | Posted on August 10, 2023We're moving into the dog days of Summer and that means one thing for the US Housing Market: more price cuts.
Every year around this time desperate sellers who have had their listings sitting on the market realize they need to get with reality and cut the price. And this year is no different, with a surge in price cuts occurring across the US Housing Market in July and August. This surge is especially pronounced in certain cities.
In this post, I will use data from Reventure App to show you the Top 10 Cities where Sellers are Cutting the Price. These are markets that are becoming more favorable to buyers and where prices will likely continue to drop in the coming months.
Understanding Historical Seasonality in the Housing Market
But first - I want to make sure you understand the historical seasonality that's evident in the US Housing Market. Because what concerns me is many people in real estate have forgotten about this seasonality.
Data from Realtor.com shows that the percentage of sellers reducing the price in July 2023 spiked up to 21.1%. Meaning that more than 1/5 of sellers reduced the price on their listings last month.
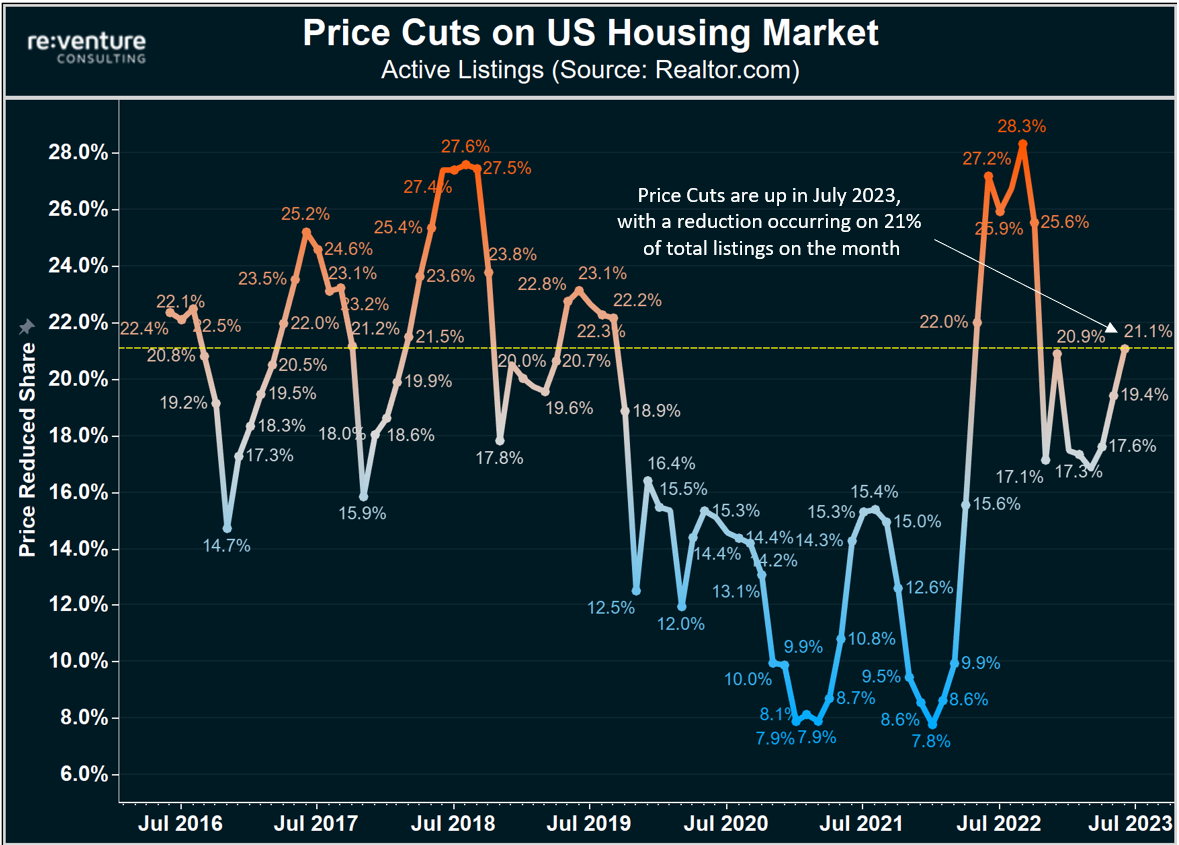
You can see this Price Cut % is up from its lows of 17% in the spring, a time when many started to believe the Housing Market was "recovering". However, what these people forgot is that sellers are always hesitant to cut the price in the spring.
But as the spring turns to summer, and summer into fall, sellers gradually lose their optimism and became more inclined to reduce the price so they can sell their house before the dead of winter. As a result, don't be surprised if price cuts continue to increase over the next several months and eventually peak in the Late Fall (perhaps around 28% of listings), as they tend to do in most years.
Price Cuts are most common in the Mountain West, Texas, and Southeast
But there are big regional disparities in where these price cuts are occurring in the US Housing Market. In particular, sellers are most likely to cut the price in the Mountain West Region of the country, with states like Colorado, Utah, and Idaho leading the charge with price cut rates from 27-28%.
(Which again - means that 28% of sellers reduced the price on their listings in July 2023).
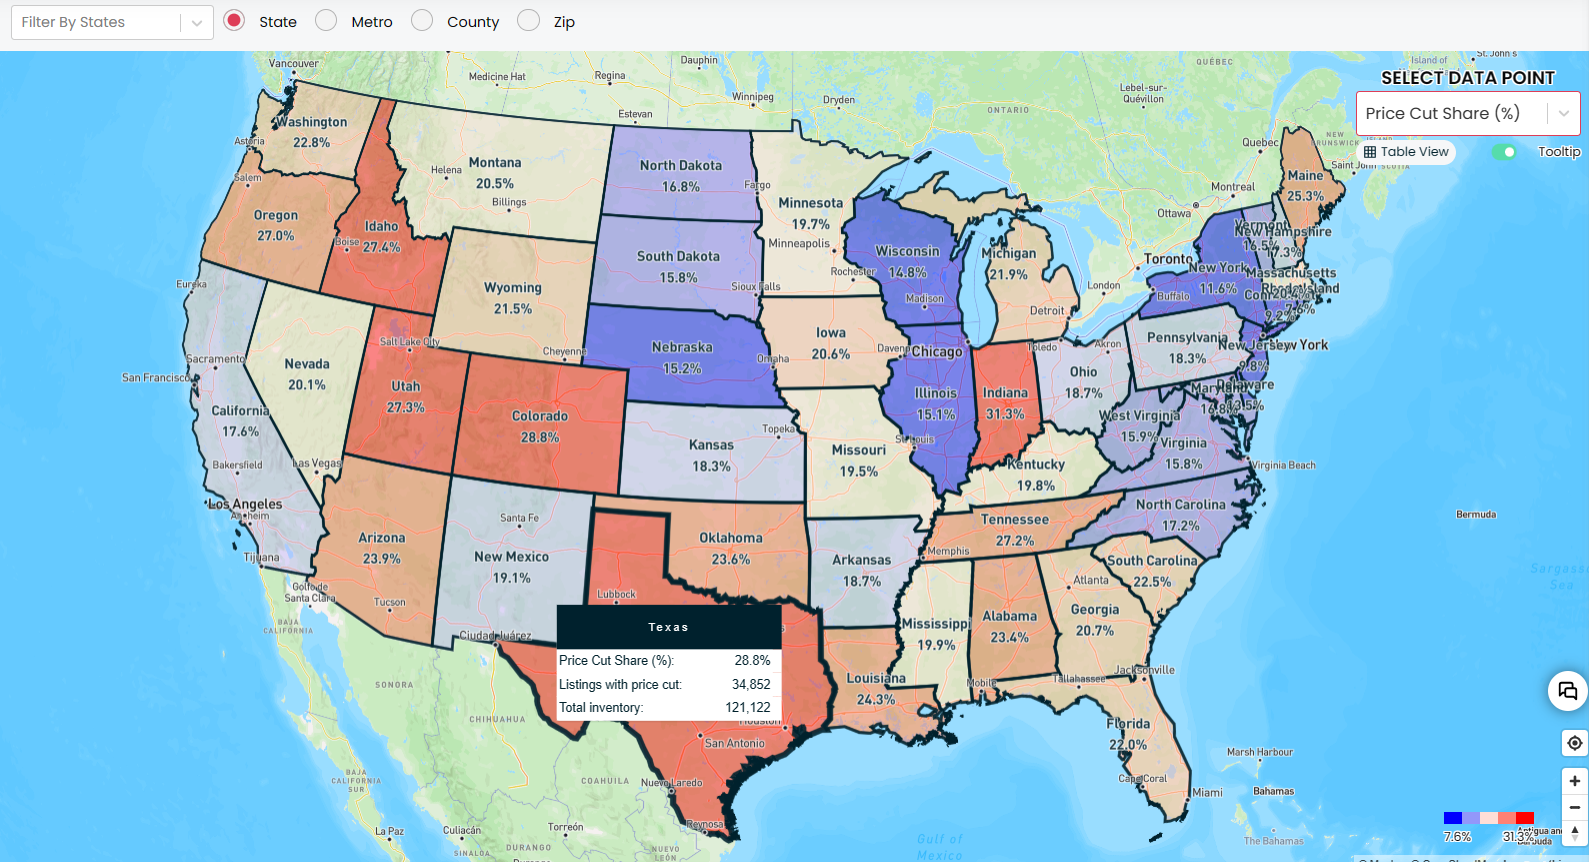
You can also see that Texas is a state with lots of price cuts, where 28.8% of sellers reduced the price in July according to data available in Reventure App. Texas' rate of price cuts was actually so high that it ranked 2nd in America (tied with Colorado).
Interestingly, the state with the most price cuts right now is Indiana, where 31% of sellers reduced the price in July. I suspect these price cuts are related to some economic weakness showing up across the state, with unemployment figures recently increasing for metros like Indianapolis, Elkhart, and Fort Wayne.
Meanwhile, Price Cuts remain low in the Northeast and Midwest. These Housing Markets are still very tight, with low inventory and surprisingly resilient buyer demand. The result is that states like Rhode Island, Connecticut, and New Jersey had a price cut share below 10% in July.
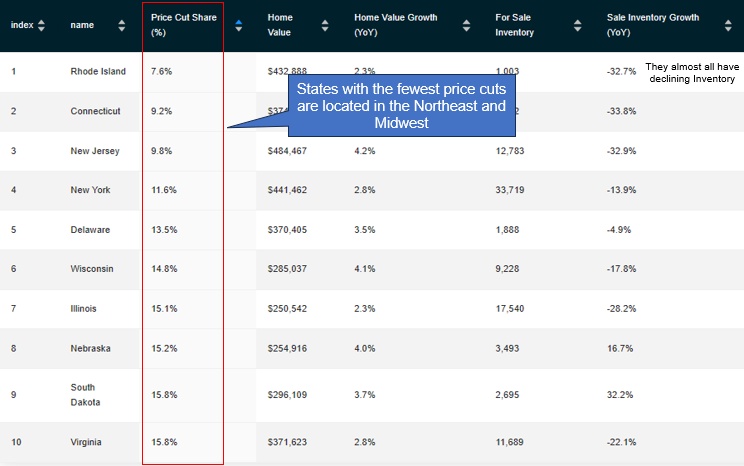
Note that almost all of these states had declining inventory over the last year to go along with the lower price cuts. A signal of how inventory levels and seller desperation to reduce the price are correlated.
Top 10 Cities Where Sellers are Reducing the Price
With all of that context out of the way - let's get into the meat of this post. What are the cities where sellers are cutting the price the most right now? These will be the ones where buyers will see likely see the most relief over the next several months.
(To put together this list, I switched Reventure App to "Metro View", and filtered out any metro with a population below 250,000. I then hit "Table View" in the top right to see the list.)
10. San Antonio, TX (31%)
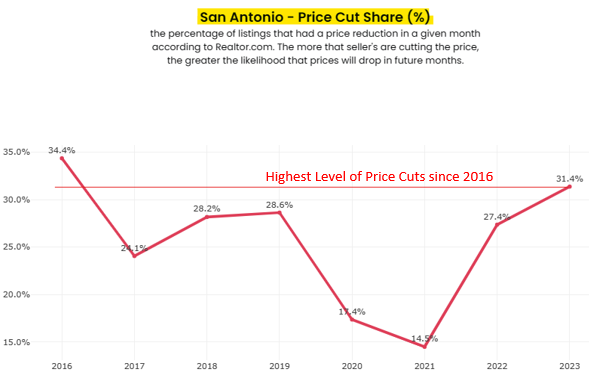
31.4% of sellers cut the price in San Antonio over the last month, a signal that homebuyers in Texas' third-largest metro should expect continued relief over the next couple of months. What's more, this 31% price cut share was the highest San Antonio has experienced since back in 2016, another positive sign for homebuyers.
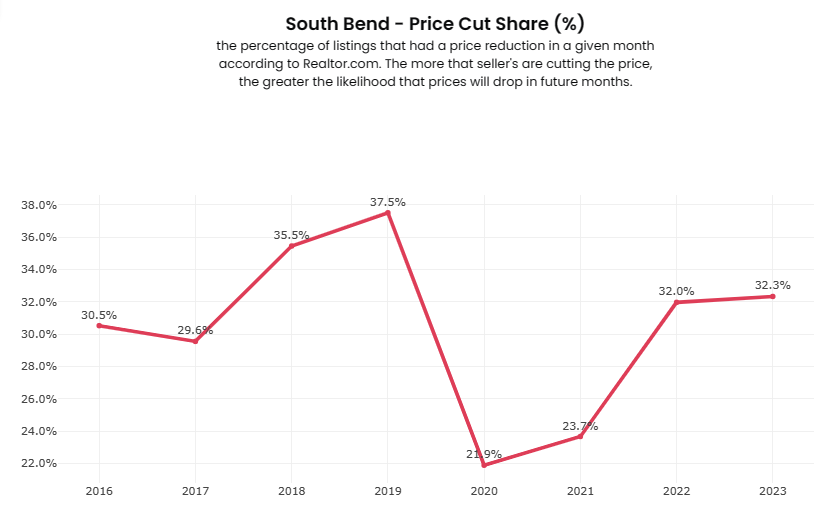
9. South Bend, IN (32%)
South Bend is a sleepy metro area in Northern Indiana that borders Michigan and is made famous by the presence of Notre Dame University. Home prices across the metro have gone up a lot over the last several years, appreciating by over 30% since 2020. But perhaps they went up by too much, with sellers in South Bend now cutting the price at the highest rate since before the pandemic.
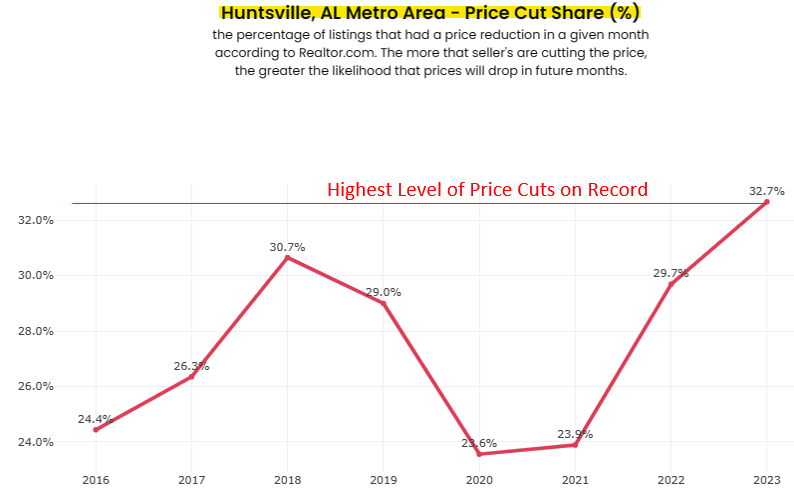
8. Huntsville, AL (33%)
Dubbed the "rocket city", Huntsville is an economic growth all-star that boasts one of the highest concentrations of engineers and software developers in America. A favorable business climate, low property taxes, and the presence of space and military institutions such as Lockheed Martin, Blue Origin, and NASA propelled home prices to double over the last decade. But now the air is slowly seeping out of the balloon, with 32.7% of sellers cutting the price in Huntsville last month. That was the highest level on record for July.
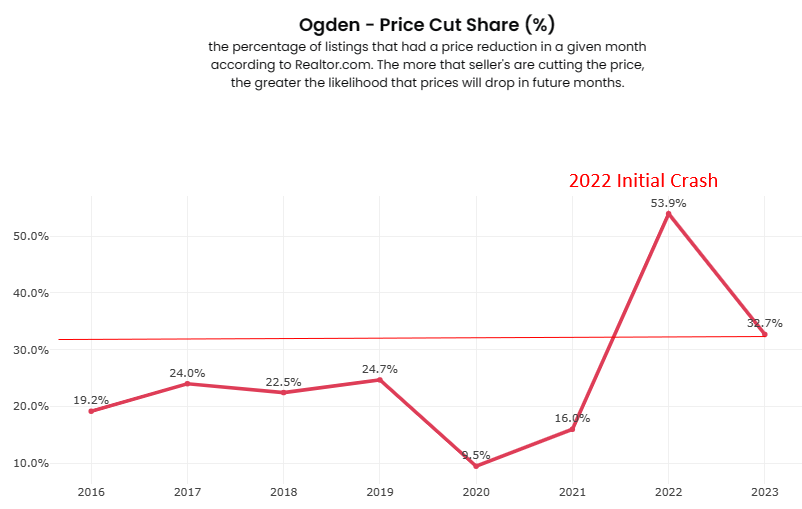
07. Ogden, UT (33%)
Utah has been hit fairly hard by the Housing Downturn thus far, with historically low levels of buyer demand in 2022 and 2023 to go along with home prices that have dropped by 5-10%. A metro like Ogden, located directly north of Salt Lake, has struggled especially. Nearly 33% of sellers cut the price in Ogden last month, which is down from the massive 54% last year, but still much higher than long-term norms.
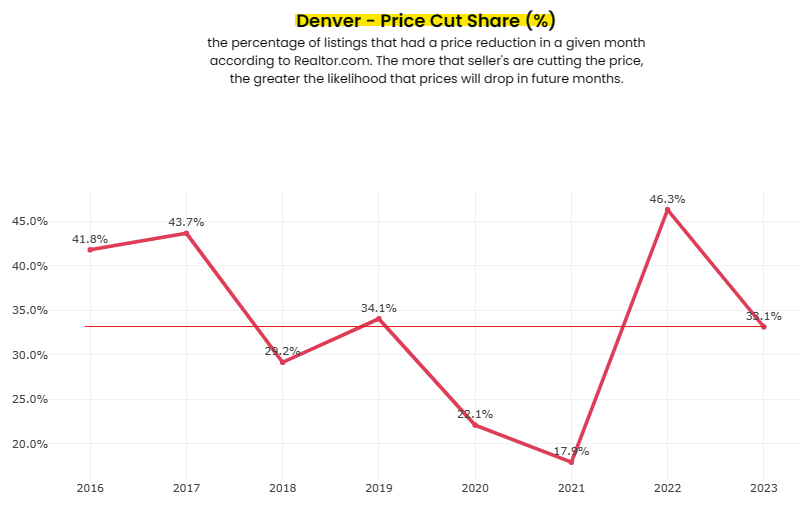
06. Denver, CO (33%)
Denver is a market that highlights why it's important to look at the history of price cuts within a metro. Because on the surface, its 33.1% price cut share in July looks very high compared to other markets. However, in the context of Denver's history, 33.1% isn't all that high. It's a fairly "normal" level of price cuts for a market where sellers tend to list high and then rapidly reduce the price to a more acceptable level for buyers.
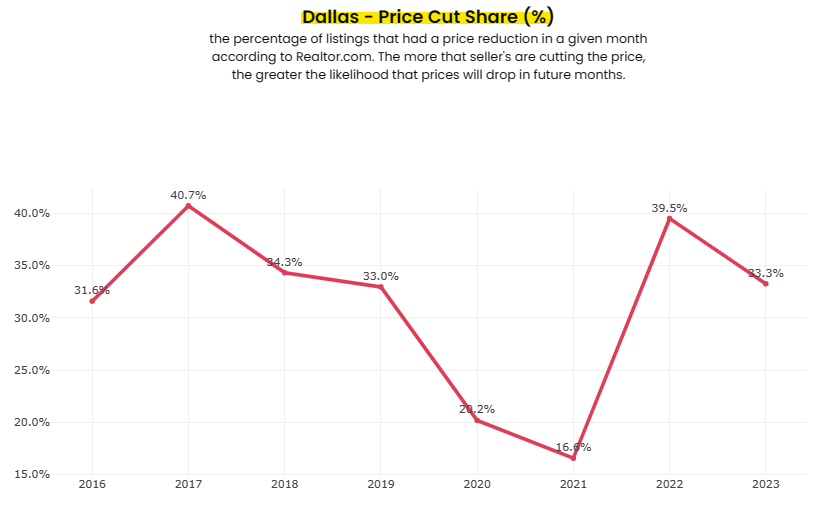
05. Dallas, TX (33%)
It's a similar situation with Dallas at #5. Prices across the DFW metro have resumed their decline after a brief "mini-rally" in the spring, with 33.3% of sellers reducing the price in July. This is more than double the levels of price cuts that occurred in 2021 during the peak of the pandemic mania. However, it's a fairly normal level for Dallas' history.
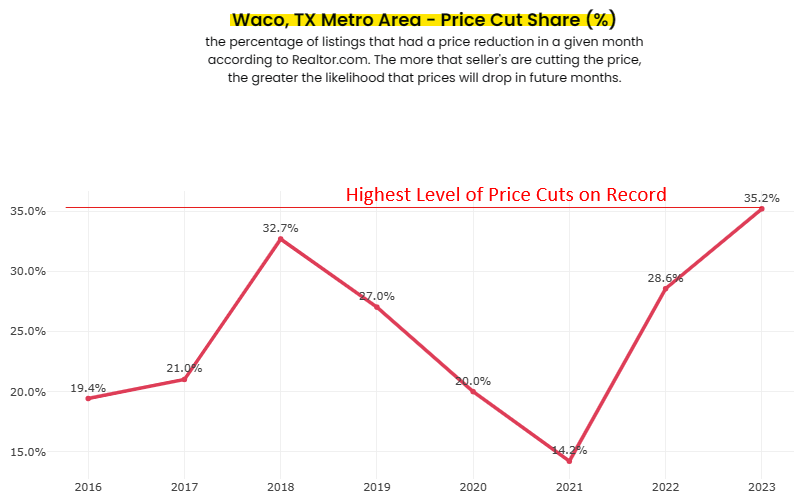
04. Waco, TX (35%)
Chip and Joanna Gaines won't like to see this one. Waco, TX, the hometown of the famous HGTV home flippers, is in the beginning stages of a housing downturn, with 35.2% of sellers reducing the price in July. That's way higher than the low of 14% that occurred in 2021 during the pandemic boom. And it's also the highest level of price cuts in Waco going back to 2016.
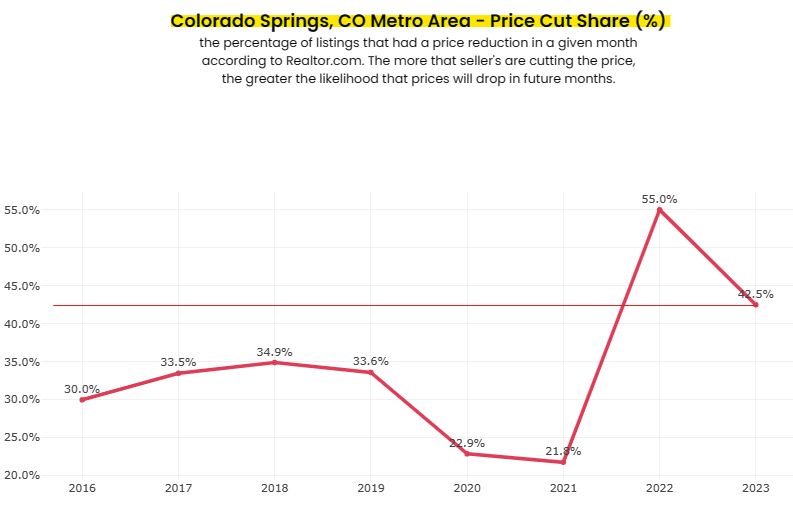
03. Colorado Springs, CO (43%)
In a post two weeks ago I observed that military towns are performing the best so far in the 2022-23 housing downturn. However, this trend does not extend to Colorado Springs, which posted a hefty 42.5% price cut share in July 2023. While this figure was down slightly from last year, it's still way up from historical norms, indicating that prices are likely to continue to drop in Colorado Springs.
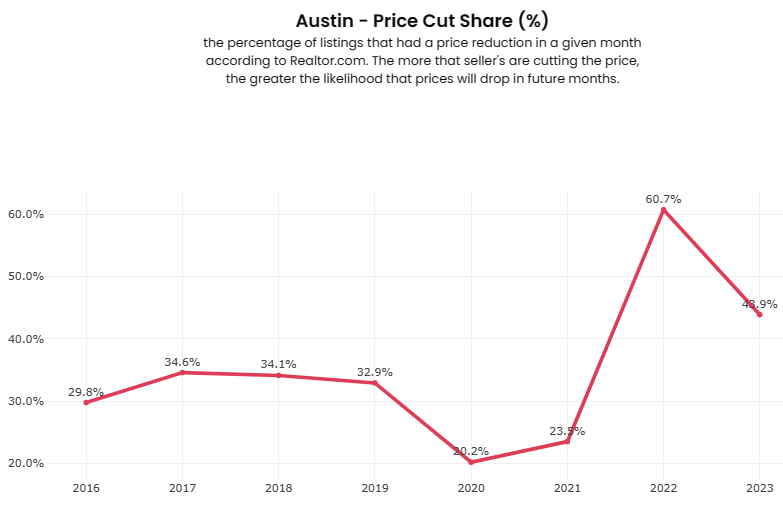
02. Austin, TX (44%)
Everyone knows that Austin's Housing Market is crashing. Prices are already down by a lot. The trouble is - prices are still too high given the current level of mortgage rates and property taxes. Meaning that sellers are still being forced to cut the price at an above-average rate, with 43.9% of listings seeing a reduction in July. That's markedly lower than the 61% level of last year, but still well above the historical norms.
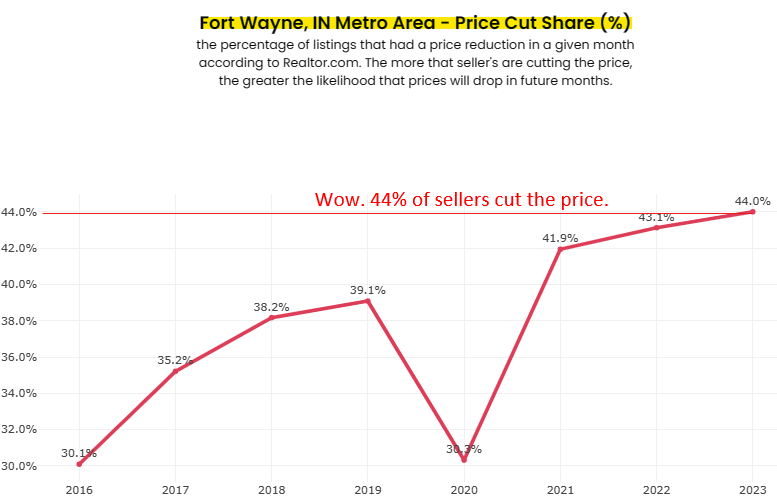
01. Fort Wayne, IN (44%)
Fort Wayne is located in northeast Indiana and is a strange Housing Market. Inventory is low and home prices have gone up over the last year. However, nearly half of all sellers have cut the price in July in the last several years. This is another example of a market where sellers list their house high, and then rapidly cut the price to bring it back in line with buyer expectations.
Pros and Cons of using Price Cut %
To wrap things up - I'd like to conclude with some words about how to use Price Cut % data to make a better decision as a homebuyer or investor.
Ultimately, this is a very useful data point that tells you how much pressure sellers are feeling to cut the price on their listing. Higher levels of price cuts are obviously better for buyers and an indication that prices will fall further.
However, this data needs to be used with historical context. In some cities, price cuts are historically more common than in others. So what you really want to look out for are deviations in Price Cuts from the historical norm. This is what will tip you off about changes in the market.
Fortunately, Reventure App allows you to track the history of Price Cuts in every State, Metro, County, and ZIP Code in America with data sourced from Realtor.com. Make sure to utilize the "Graph" view on Reventure App to see this history. Graph view can be accessed by clicking an area on the map, or by hitting Graphs on the top right of the page.

Finally - make sure to leave a comment and let me know how the price cut situation is trending in your market. Are you seeing more sellers cut the price? If so, by how much?
-Nick
